
Feature Overview
Latest Enhancements in Predictions Module is a set of improvements to the Synerise Predictions module that includes a simplified custom predictions creator, improved Scratch mode with event-based feature selection, a unified default Overview dashboard, and the ability to add custom analytical dashboards to the Statistics tab.
The improvements apply to the Predictions module in Synerise.
What Are the Predictions Module Enhancements?
The Predictions Module Enhancements are a collection of usability and analytical improvements to prediction creation and monitoring in Synerise. Key changes include: a simplified creator for custom predictions with an expanded template library, an improved Scratch mode that allows selecting specific events as prediction inputs, a unified default Overview dashboard across all prediction types, and the ability to attach custom analytical dashboards to the Statistics tab for detailed KPI monitoring.
Why the Predictions Module Enhancements Matter
Creating and monitoring predictive models requires both technical expertise and clear analytical output. Without simplified creation workflows and unified dashboards, teams spend excessive time on setup and lack consistent visibility into prediction performance.
The Predictions Module Enhancements address this by:
- Simplifying custom prediction creation with a guided, step-by-step creator
- Enabling segment-based prediction targets — eliminating the need for extra rules, aggregates, and expressions
- Allowing specific event selection in Scratch mode for simpler feature configuration
- Providing a unified Overview dashboard with consistent metrics across all prediction types
- Supporting custom analytical dashboards attached to the Statistics tab for precise KPI monitoring
Key Capabilities
Simplified custom predictions creator
A guided creator walks users through the entire custom prediction setup process in a few simple steps. The expanded template library provides starting points for common prediction scenarios. Prediction targets can be defined using segments, removing the need for additional rules and expressions.

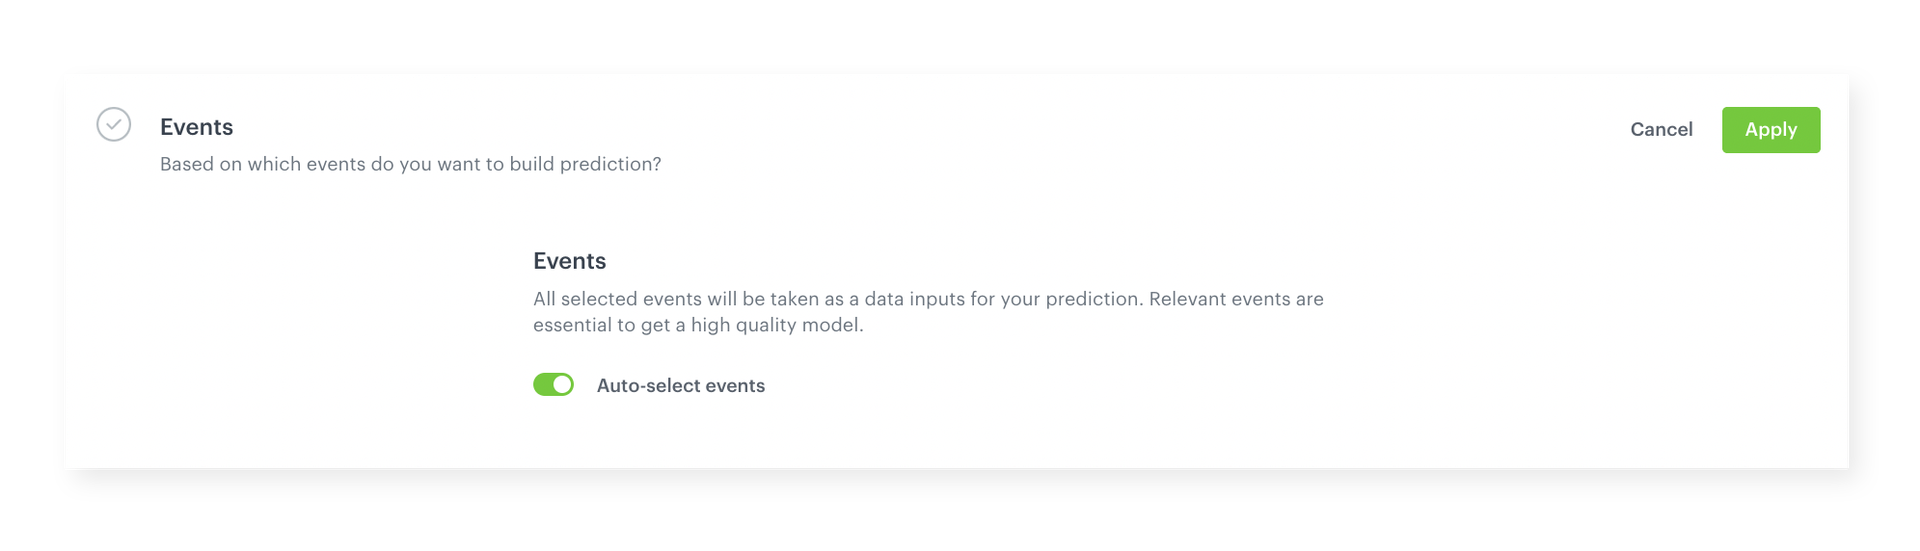
Improved Scratch mode
Select specific events to use as prediction inputs directly in Scratch mode. Instead of manually configuring complex feature sets, users highlight the relevant events and the system handles the analysis automatically.
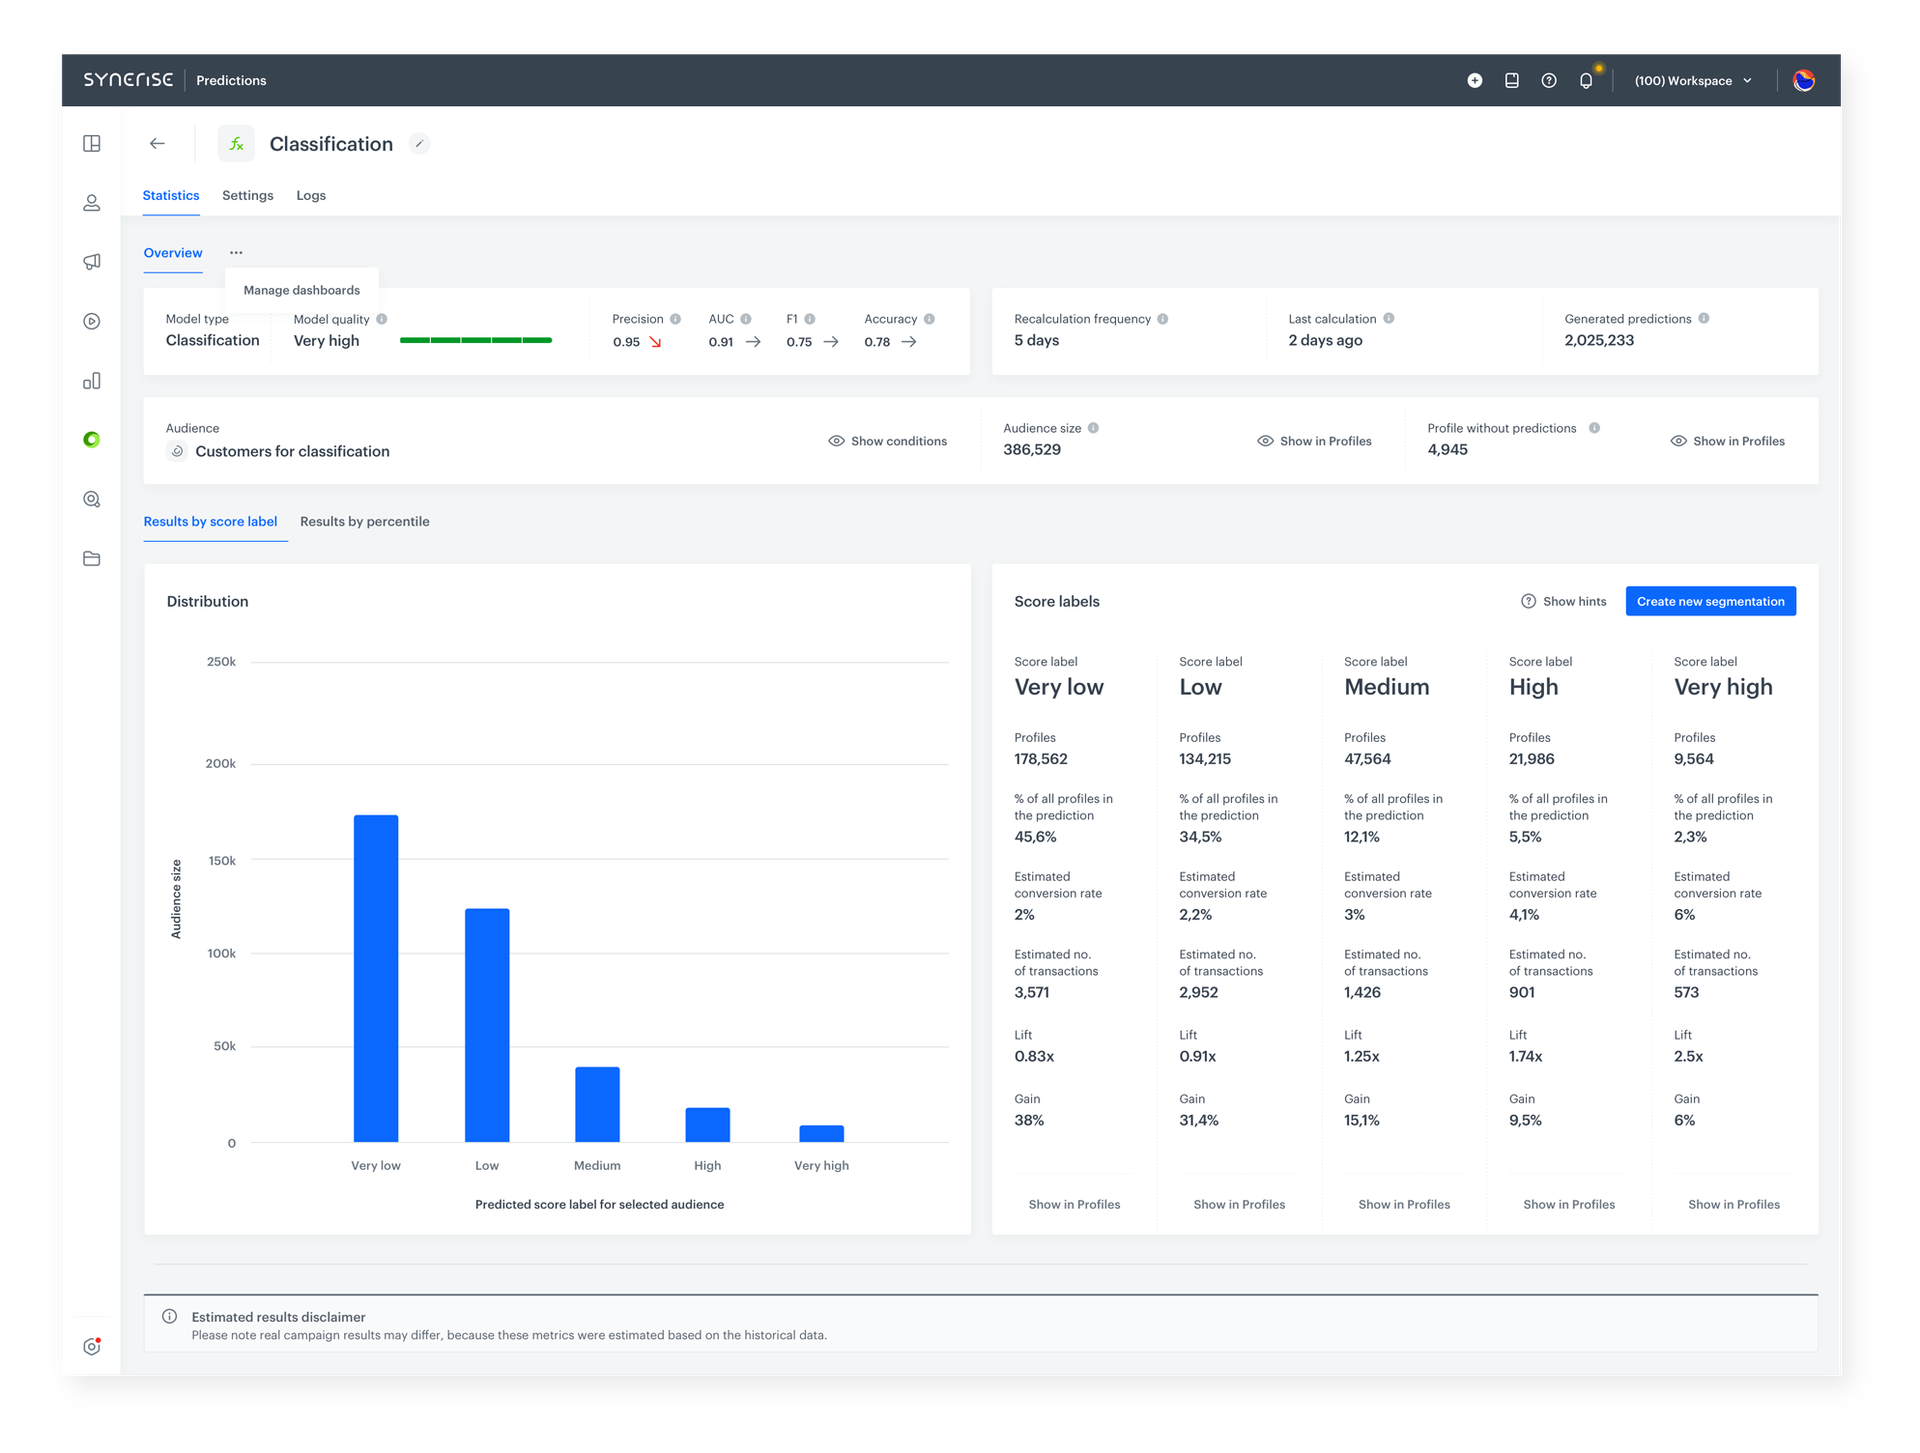
Unified default Overview dashboard
A consistent Overview dashboard across all prediction types provides quick access to key metrics such as lift and gain. Segments of interest can be created directly from the dashboard, regardless of the model type.
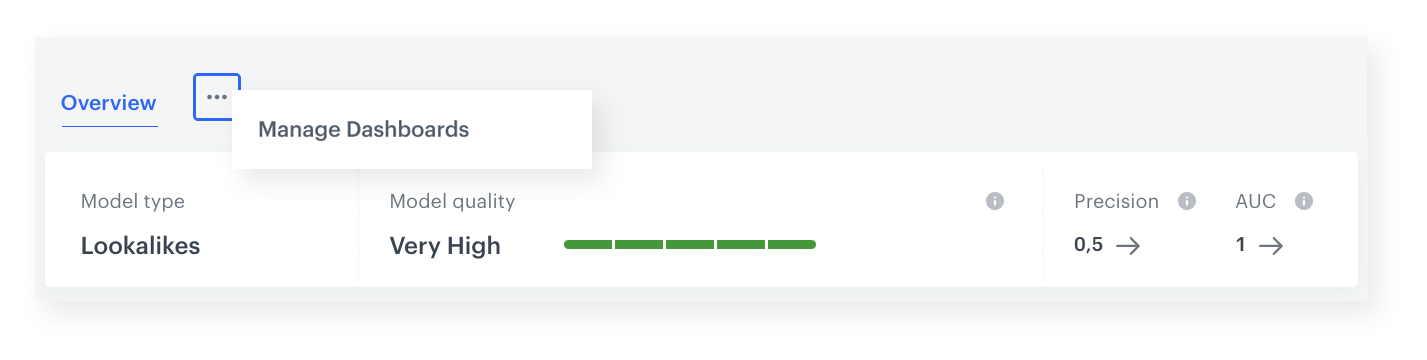
Custom analytical dashboards in Statistics tab
Attach custom dashboards from the Analytics module to the Predictions Statistics tab. This enables monitoring of specific KPIs with higher precision, with all relevant predictive model information accessible from a single prediction-level view.
How the Predictions Module Enhancements Work
- Use the simplified creator or expanded template library to set up a custom prediction in guided steps.
- Define the prediction target using a segment (no extra rules or expressions needed).
- In Scratch mode, select specific events as prediction inputs — the system handles feature analysis.
- Review results in the unified Overview dashboard with lift, gain, and segment creation tools.
- Optionally attach custom analytical dashboards from the Analytics module to the Statistics tab for detailed KPI tracking.
Example Use Case
An e-commerce company wants to predict which customers are likely to churn in the next 30 days. Using the simplified creator, a data analyst selects a churn prediction template, defines the target group using an existing customer segment, and in Scratch mode selects purchase, page view, and cart abandonment events as inputs. After the model runs, the unified Overview dashboard shows lift and gain metrics. A custom dashboard tracking retention KPIs is attached to the Statistics tab for ongoing monitoring — all without writing custom code or building complex feature sets manually.
FAQ
What improved in the Predictions module?
Custom prediction creation was simplified with a guided creator, Scratch mode now supports event-based input selection, a unified Overview dashboard is available across all prediction types, and custom dashboards can be added to the Statistics tab.
Do I still need to create rules and expressions for prediction targets?
No. Prediction targets can now be defined using existing segments, eliminating the need for additional rules, aggregates, and expressions.
Can I customize the analytics view for predictions?
Yes. Custom dashboards created in the Analytics module can be attached to the Predictions Statistics tab.
Key Facts
| Attribute | Value |
|---|---|
| Feature | Predictions Module Enhancements |
| Product | Synerise |
| Module | Predictions |
| Purpose | Simplified prediction creation, improved Scratch mode, unified dashboards, custom analytics |
| Creator | Guided step-by-step with expanded template library |
| Scratch Mode | Event-based input selection with automatic feature analysis |
| Dashboards | Unified Overview + custom Analytics dashboards in Statistics tab |
Related Concepts
- Discover the Perfect Match for Every Customer with Best-Fit Predictions
- Discover Synerise's Brand New Prediction Templates
- Improved Model Handling and Prediction Logs
- Predictive Filtering
- Analytics module in Synerise
TL;DR
The Predictions Module Enhancements in Synerise introduce a simplified custom predictions creator with segment-based targeting, an improved Scratch mode with event-based input selection, a unified Overview dashboard with consistent metrics across all prediction types, and the ability to attach custom analytical dashboards to the Statistics tab. These changes reduce the complexity of prediction setup and provide clearer analytical output.