Subtitles available in English, Spanish, Brazilian Portuguese
TL;DR
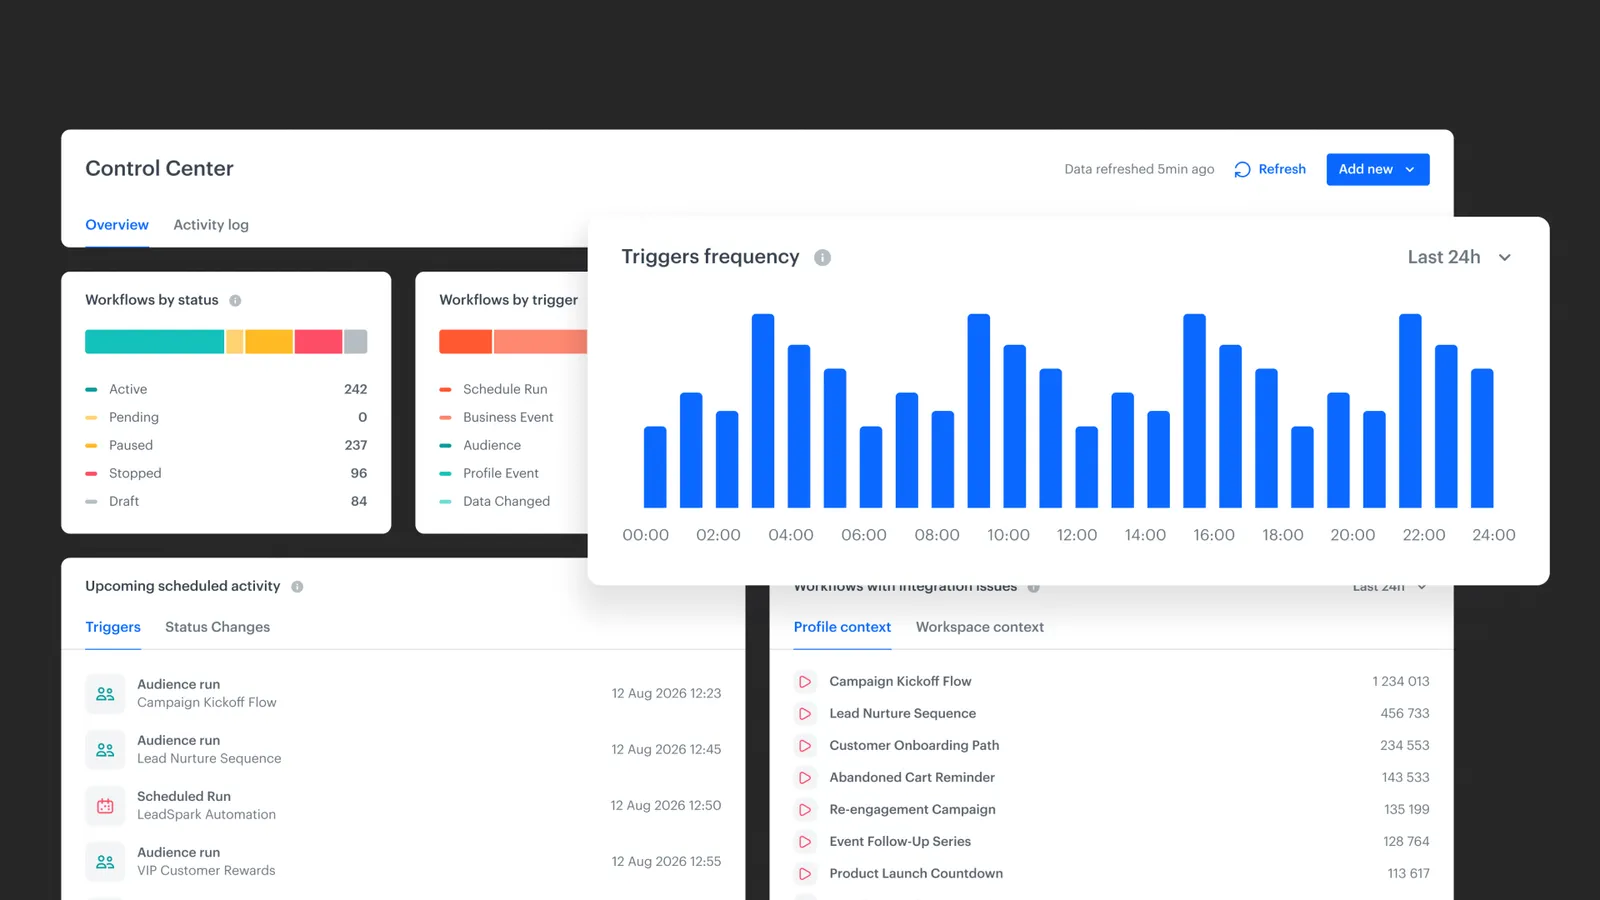
Automation Control Center is a centralized dashboard in Synerise Automation Hub that provides workspace-wide visibility into workflow execution, errors, scheduling, and user activity. It helps people understand automation at scale, identify workflows that need attention, and detect performance issues without inspecting each workflow individually. Errors are split into profile context and workspace context, so customer-facing problems surface separately from technical ones, and the data is based on Automation statistics, so event retention in the workspace does not affect what you see.
When something breaks in an automated journey, who notices first, your team or your customer?
We've introduced Automation Control Center in Synerise Automation Hub. It's available now to anyone with Control Center access permissions, no configuration required. Those running 50+ workflows have the dashboard as their default first view.
What this shifts in practice
- You see the shape of your automation strategy at a glance. The trigger breakdown shows whether your setup is event-driven or rules-based, and how that balance has shifted over time.
- Marketing, CRM, and data engineering work from one shared view. The profile-context and workspace-context split gives each role the slice they care about, on the same dashboard.
- You can see which workflows carry the heaviest load. Workflow highlights surfaces the workflows generating the most transitions and pending profiles, useful for capacity planning, not just incident response.
- The data does not depend on event retention. Control Center reads from Automation statistics, so what you see is consistent even when raw event data has aged out of the workspace.
What is Automation Control Center
Automation Control Center is a capability in Synerise Automation Hub that gives a workspace-wide read on how every workflow is performing. It aggregates running and scheduled workflows into one view, with metrics on volume, trigger types, errors, upcoming scheduled changes, and user activity. It does not surface individual workflow configuration; that still happens at the workflow level.
Key Capabilities
Workflows by status
A breakdown of every workflow by current state: Active, Pending, Paused, Stopped, or Draft. Useful for identifying workflows that are no longer running, temporarily disabled, or potentially abandoned and waiting for review.
Workflows by trigger
Groups workflows by how they start. Reveals whether your setup leans rules-based (audience-driven or schedule-driven) or event-driven (real-time behavioral signals). A diagnostic for whether your automation strategy matches your stated intent.
Triggers frequency
The Triggers frequency widget displays how often workflows are triggered over a selected time range. The execution charts let users:
- observe peaks and drops in activity,
- detect anomalies,
- investigate potential configuration or data issues.
Upcoming scheduled activity
Aggregates scheduled triggers and scheduled status changes. From this view, you can edit or stop a scheduled action without opening the workflow diagram.
Workflows with integration issues
Counts errors from outgoing integrations within a time window: HTTP 4xx and 5xx, timeouts, rendering failures. Sorted by volume so the loudest offenders surface first. Errors are split into:
- Profile context: workflows operating on customer profiles.
- Workspace context: technical workflows that do not touch profiles.
This split lets you separate a broken push notification from a broken backend sync, and route them accordingly.
Workflow highlights
Surfaces workflows that:
- are triggered most often,
- generate the highest number of transitions,
- contain the largest number of pending profiles.
These indicators help identify workflows that may generate high system load or contain processing bottlenecks.
Activity log
Workflow creation, modification, and deletion events across the entire Automation Hub. Filterable by user, with links to the affected objects.
Authors
Release note contributors: Magdalena Góralska (Product Evangelist), Kamil Gaczoł (Senior Product Manager).
For setup details, widget reference, and configuration options visit our documentation
FAQ
Does Automation Control Center replace workflow-level analysis?
No. It sits above it. Workflow-level inspection still happens when you need to debug or edit configuration. The Control Center decides which workflow you should be looking at in the first place.
What counts as an error in the integration issues widget?
HTTP 4xx and 5xx responses, timeouts, and rendering failures from outgoing integrations. Errors are aggregated within a selected time window and sorted by volume per workflow.
How does the profile context vs. workspace context split work?
Workflows that operate on customer profiles are tagged as profile context. Workflows that do not touch profiles, typically technical or operational ones, are tagged as workspace context. Errors are reported separately for each.
Can I take action on workflows directly from the dashboard?
Yes. Each widget links to the relevant workflow, and from Upcoming scheduled activity you can edit or stop scheduled actions without opening the workflow diagram.
What can a Synerise AI Agent do with Automation Control Center today?
The Activity log and aggregated widgets produce structured, queryable data about Hub activity. An agent with workflow context can read the same signals a person reads: who changed what, where errors concentrate, which workflows are quiet, and use them as input when answering questions about the state of your automation estate. The direction is toward agents that monitor the Hub the way an operator does, not just execute inside it.
Key Facts
| Attribute | Value |
|---|---|
| Feature | Automation Control Center |
| Module | Synerise Automation Hub |
| Purpose | High-level observability and management of automation at scale |
| Scope | Statuses, triggers, executions, errors, scheduling, user activity |
| Context types | Profile context, workspace context |
| Error types monitored | HTTP 4xx/5xx, timeouts, rendering failures |
| Configuration | None required |
| Access | Users with Control Center access permissions |
| Action from dashboard | Navigate to workflow, edit, stop scheduled actions |
| Data source | Automation statistics (independent of event retention) |