Feature Overview
Improved Model Handling and Prediction Logs is a set of enhancements to the Synerise Predictions module that introduces a visual stage bar for tracking prediction progress, a Prediction Logs tab with detailed run history, and improved error and warning messages for data quality issues.
The improvements apply to the Predictions module in Synerise.
What Are Improved Model Handling and Prediction Logs?
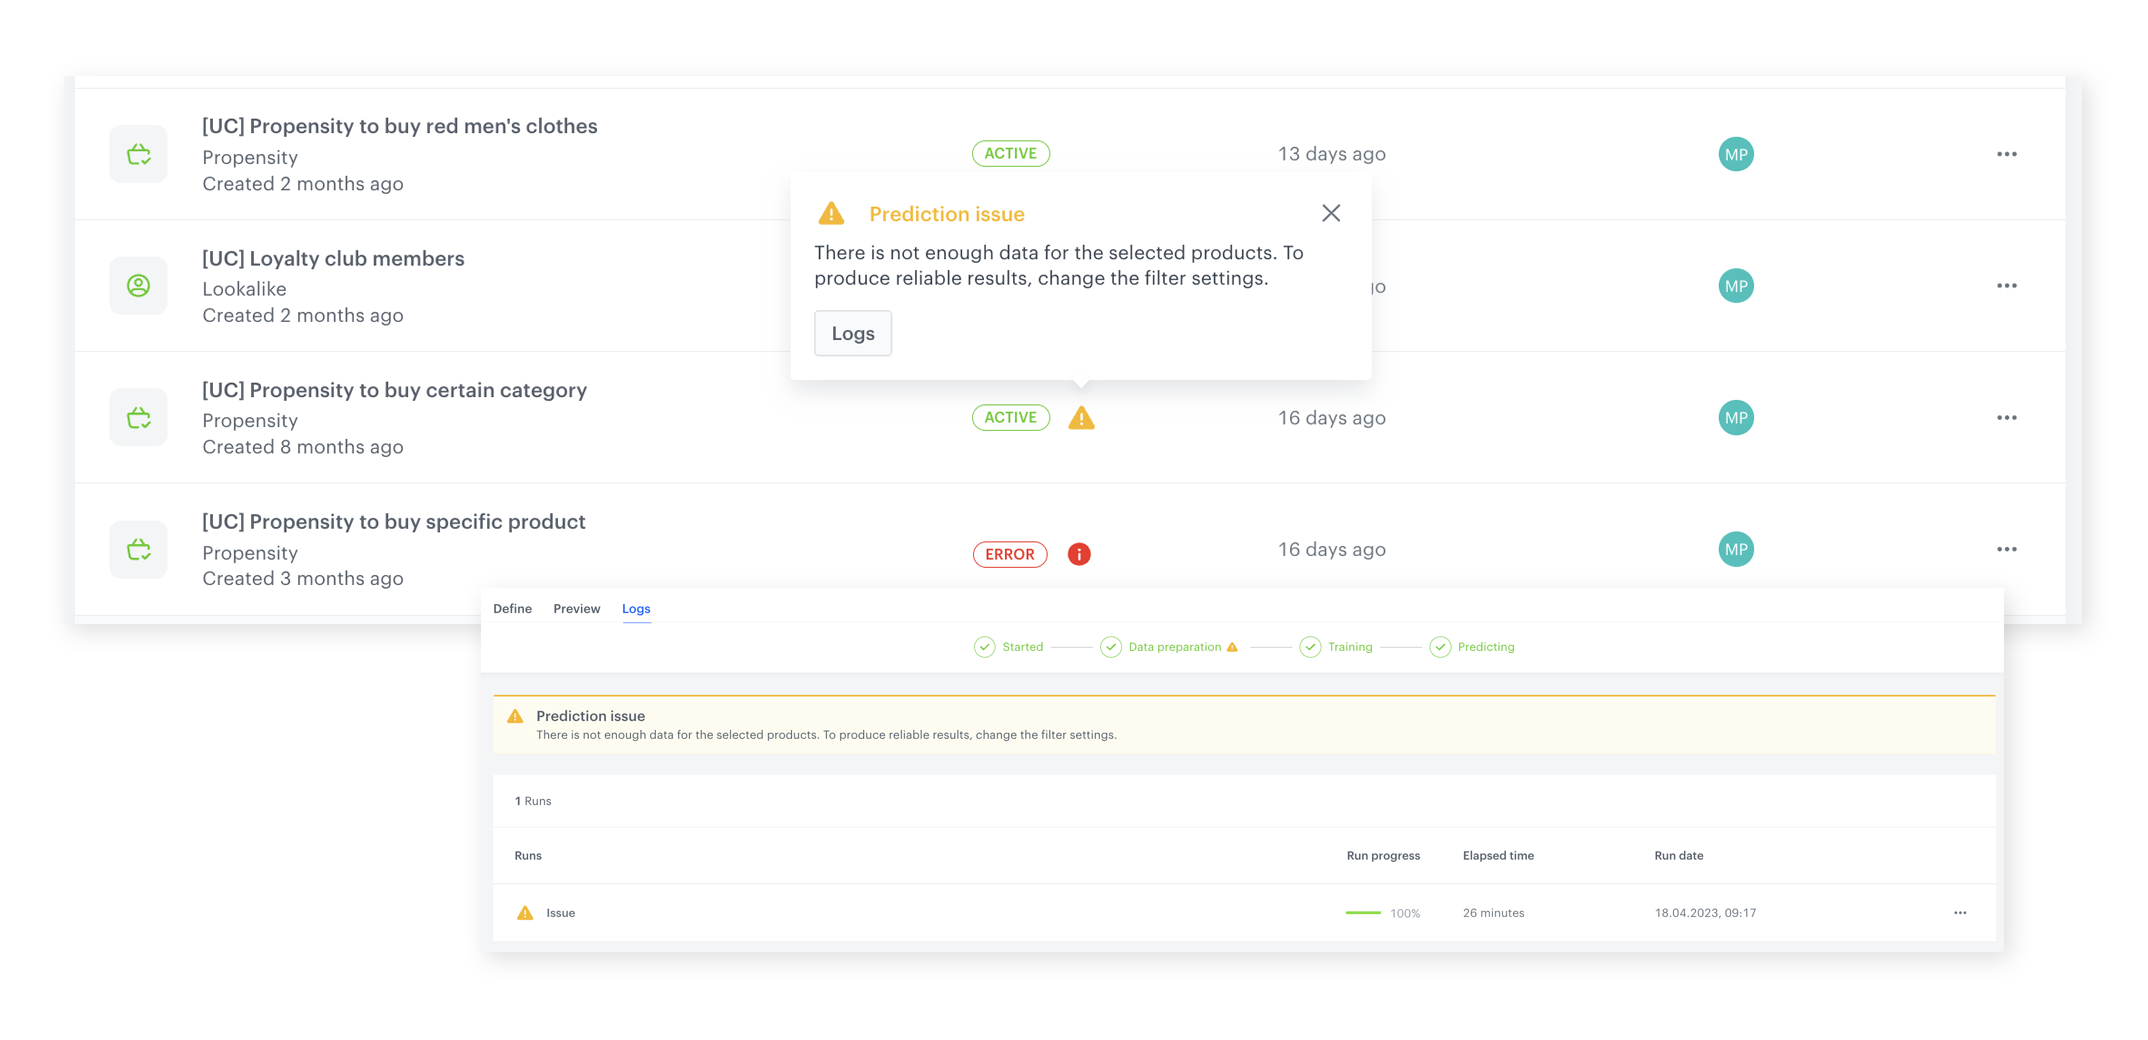
Improved Model Handling and Prediction Logs are monitoring and troubleshooting enhancements for the Synerise Predictions module. A visual "Stage bar" shows the real-time progress of activated predictions through pipeline stages. A new "Prediction Logs" tab displays the final states and reasons for the 10 most recent model runs — including stage progress, calculation percentage, duration, and timestamps. Error and warning messages provide clear explanations when data does not meet prediction requirements, enabling quick identification and resolution of issues.
Why Improved Model Handling Matters
Without visibility into prediction pipeline progress and clear error reporting, troubleshooting failed or underperforming predictions requires manual investigation and guesswork. Teams cannot easily identify whether issues stem from data quality, configuration errors, or processing failures.
Improved Model Handling addresses this by:
- Providing real-time visual progress tracking through the prediction pipeline stages
- Logging the final states and details of the 10 most recent prediction runs
- Delivering clear error and warning messages when data does not meet requirements
- Enabling log copying and sharing for team collaboration on troubleshooting
Key Capabilities
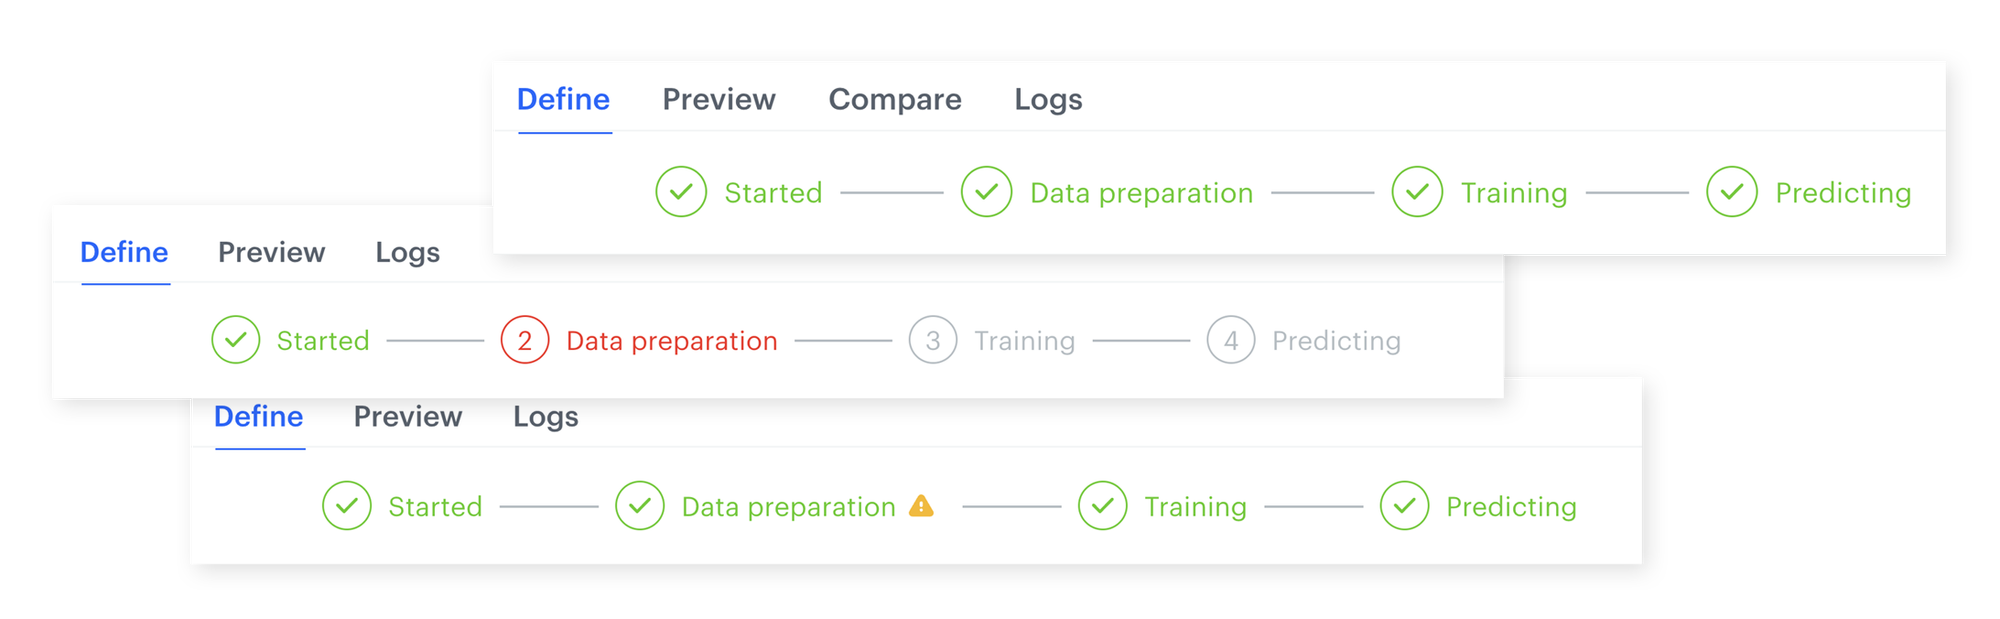
Stage bar
A visual progress indicator showing the current stage of an activated prediction in the pipeline. Provides real-time status tracking for each stage of the prediction calculation process.
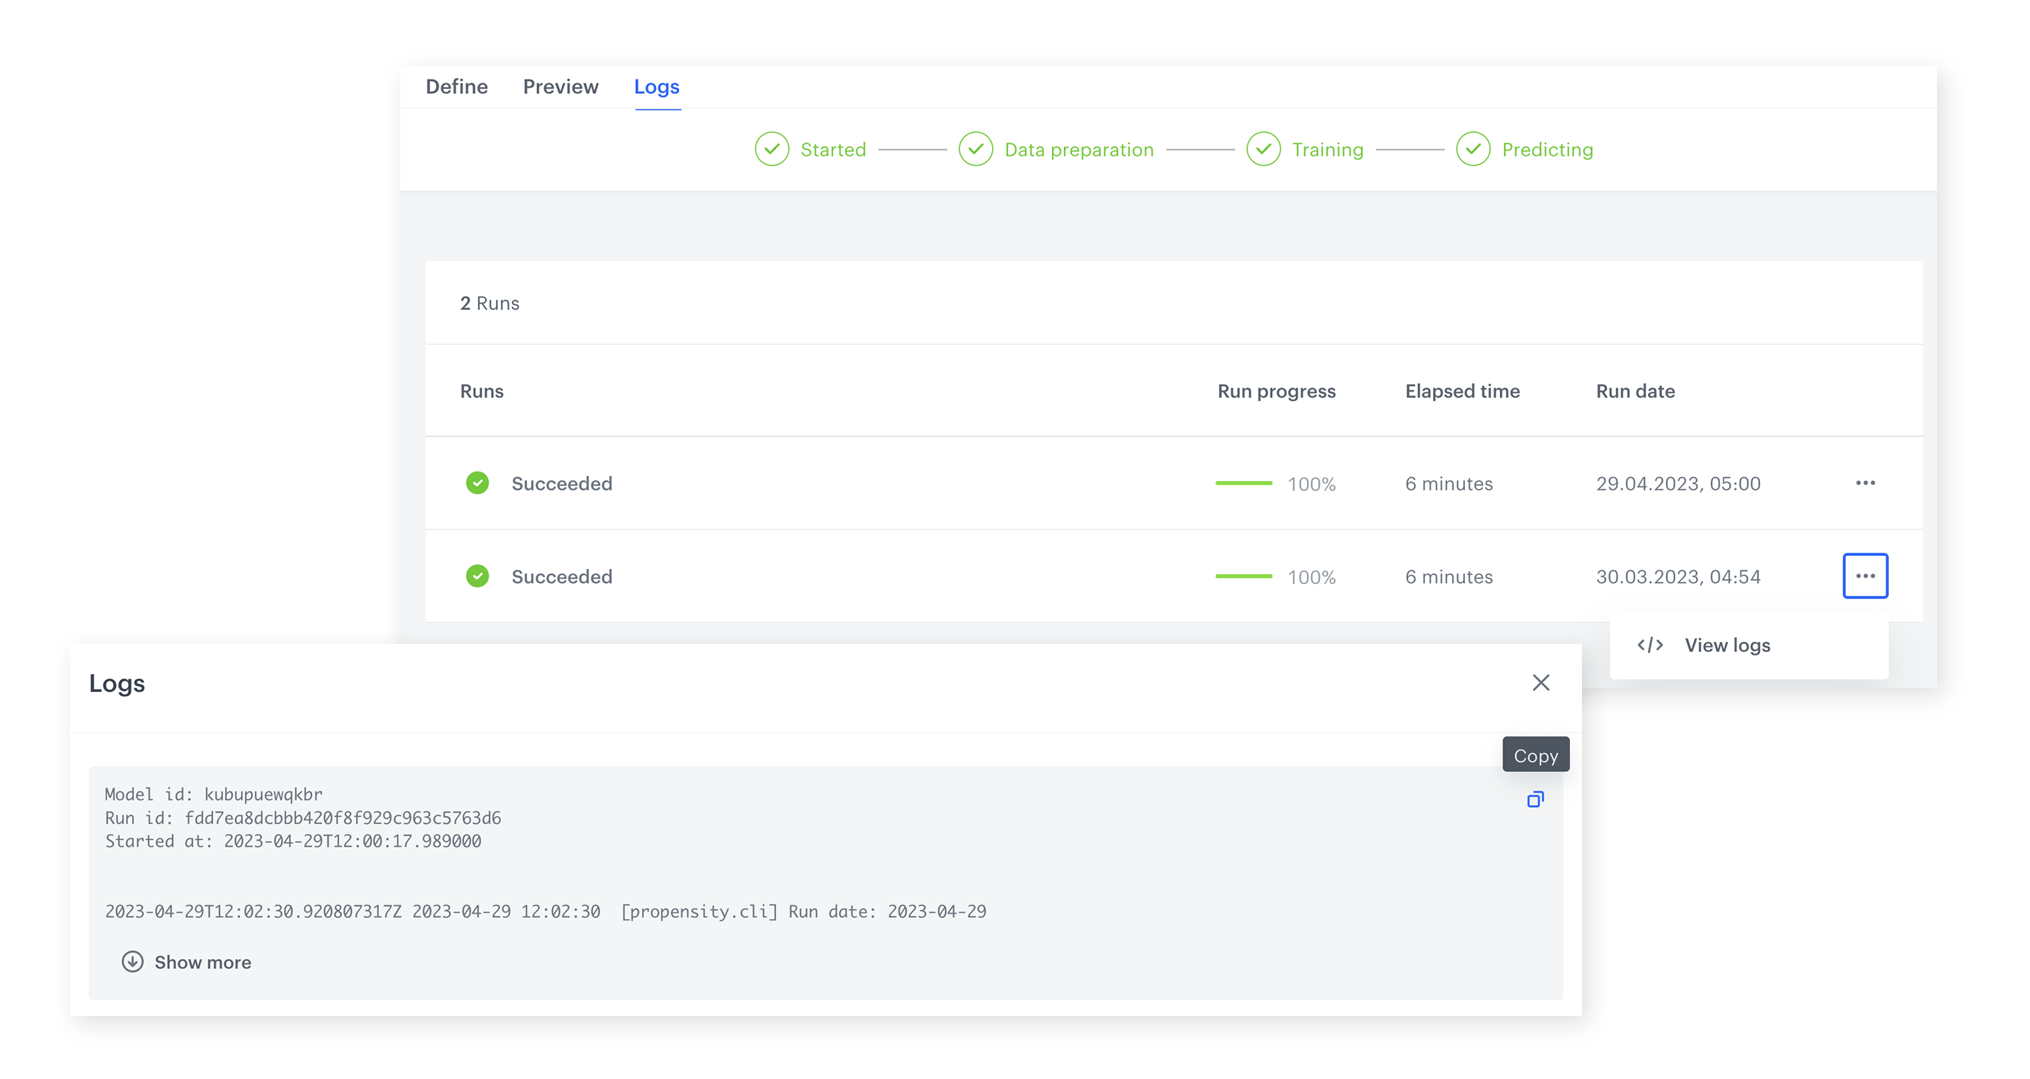
Prediction Logs tab
A dedicated tab displaying the final states and reasons for the 10 most recent model runs. Each log entry includes the current stage, calculation progress percentage, duration, and start timestamp. Logs can be copied and shared with team members.
Error and warning handling
Clear, actionable error and warning messages when data does not meet prediction requirements. Messages are visible from both the prediction listing and individual prediction levels, enabling early identification of data quality issues.
How Improved Model Handling Works
- Activate a prediction — the Stage bar appears, showing real-time pipeline progress.
- Monitor the prediction through each stage via the visual Stage bar.
- After completion (or failure), check the Prediction Logs tab for detailed run information.
- Review error or warning messages if data does not meet prediction requirements.
- Copy logs and share with team members for collaborative troubleshooting.
- Address identified data quality issues and re-run the prediction.
Example Use Case
A data analyst activates a churn prediction model but notices it fails during processing. They open the Prediction Logs tab and see that the last run stopped at the feature engineering stage with a warning about insufficient transaction data for the target segment. The analyst copies the log, shares it with the data engineering team, and after enriching the customer transaction data, re-runs the prediction successfully — all without guessing what went wrong.
FAQ
What is the Stage bar?
A visual progress indicator showing the real-time status of each stage in the prediction pipeline.
How many prediction runs are logged?
The 10 most recent model runs are displayed in the Prediction Logs tab.
Can I share prediction logs?
Yes. Logs can be copied and shared with team members for collaborative troubleshooting.
Where do error messages appear?
Errors and warnings are visible from both the prediction listing level and individual prediction level.
Key Facts
| Attribute | Value |
|---|---|
| Feature | Improved Model Handling and Prediction Logs |
| Product | Synerise |
| Module | Predictions |
| Purpose | Real-time progress tracking, run history logging, and error/warning reporting for predictions |
| Stage Bar | Visual pipeline progress indicator |
| Logs | 10 most recent runs with stage, progress %, duration, timestamps |
| Error Handling | Clear messages at listing and individual prediction levels |
| Documentation | hub.synerise.com — Predictions |
Related Concepts
- Latest Enhancements in Predictions Module
- Discover the Perfect Match for Every Customer with Best-Fit Predictions
- Discover Synerise's Brand New Prediction Templates
- Predictive Filtering
- Redesigned Workflow Statistics
TL;DR
Improved Model Handling and Prediction Logs in Synerise introduces a visual Stage bar for real-time prediction pipeline tracking, a Prediction Logs tab with detailed history of the 10 most recent model runs (including stage, progress percentage, duration, and timestamps), and clear error/warning messages for data quality issues. Logs can be copied and shared for team collaboration on troubleshooting.