
Feature Overview
Synerise Reports now support Formula Metrics as an allowed metric type. Before this update, only Simple Metrics could be used inside the Reports module in Synerise Decision Hub.
With Formula Metrics now available in Reports, users can include calculated values directly in a single table or chart and compare them across dimensions such as user groups, event parameters, or profile attributes, which was not possible until now
What Is Formula Metrics Support in Reports?
Formula Metrics Support in Reports is a capability in the Synerise Decision Hub that extends the list of allowed metric types in the Reports module to include Formula Metrics alongside Simple Metrics.
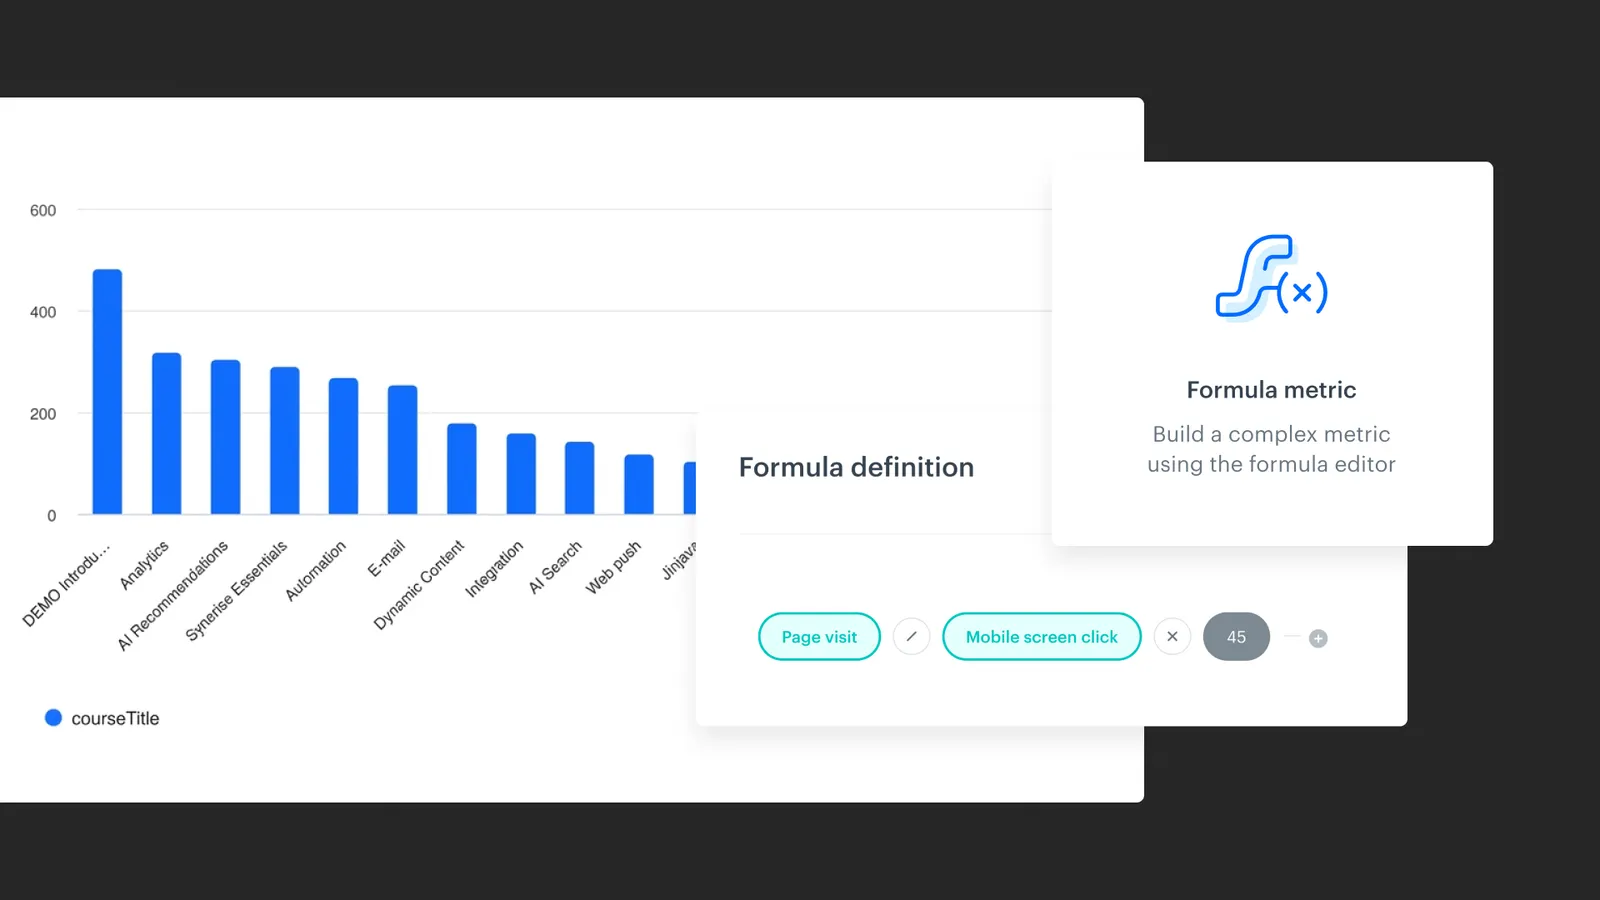
In Synerise, Simple Metrics and Formula Metrics are two metric types that a user selects in the metric builder UI. A Simple Metric returns a single aggregated value based on conditions. A Formula Metric allows users to define a custom mathematical expression — this can range from a static value (for example, 1) to complex calculations that reference other metrics, apply arithmetic operators, or use functions. The Formula Metric type is selected by the user in the UI and is independent of which data blocks (events or profile attributes) are used in the metric conditions.
Separately, Synerise classifies metrics by the type of data blocks used in their conditions — for example, whether the metric references profile attributes, events, or a combination. This classification determines which metrics can be selected in Reports and which dimensions are available. These condition-based compatibility rules apply equally to both Simple Metrics and Formula Metrics.
Why Formula Metrics in Reports Matters
Teams working with Synerise Analytics frequently need to evaluate computed ratios and rates — not just raw counts or sums. Without Formula Metrics in Reports it was time-consuming and difficult to make side-by-side dimensional comparison by making a workaround.
With Formula Metrics now supported in Reports, users can consolidate this analysis into one Report. This reduces setup effort, simplifies interpretation, and enables direct dimensional comparison within a single visualization.
Key Capabilities
Use Formula Metrics as Report data sources
Users can select any previously defined Formula Metric when configuring a Report. Formula Metrics appear alongside Simple Metrics in the metric selection dropdown within the Report builder at Analytics > Decision Hub > Reports > New report. The same compatibility rules that govern Simple Metrics also apply to Formula Metrics — compatibility is determined by the metric conditions, not the metric type.
Compare Formula Metric values across dimensions
Reports allow users to break down metric values by dimensions. The available dimensions depend on the metric conditions. With Formula Metrics included, users can compare calculated values like CTR or conversion rate across profile attributes, event parameters, or event expressions within a single table or chart.
Add time-based dimensions
Users can add a time context to a Report by including an event expression as an additional dimension. Synerise supports event expressions using functions such as Day of month, Day of week, and Day of year to display when events occurred.
How Formula Metrics in Reports Works
- Navigate to Decision Hub > Reports > New report.
- Enter a name for the Report. Optionally, add a description to communicate the purpose of the analysis to other users.
- Click Choose metric and select a Formula Metric from the dropdown list. The metric must comply with the compatibility rules described in the Key Capabilities section.
- In the Range section, select either top (highest results) or last (most recent results) to define the type of results to generate.
- Click Choose dimension to select the aspects of data from the metric to include in the Report (such as dates, names, or quantities). Available dimensions depend on the metric conditions.
- Optionally, click Add dimension to include a time context. Navigate to Events > Expressions and select an event expression (for example, Day of week). Note: it needs to be created beforehand.
- Optionally, toggle Show null values off to increase readability.
- Optionally, enable a filter to narrow down the scope of the metric data.
- Define the date range for the analysis using the calendar. The date range in the Report does not need to overlap with the date range in the metric.
- Click Save to complete the Report.
Example Use Case
A marketing team at an e-commerce company uses Synerise to run email campaigns targeting different customer segments. The team has defined a Formula Metric for email open rate (opens divided by sends) and another for click-through rate (clicks divided by opens). Both Formula Metrics use event-based conditions with a single event type.
Previously, the team had to create separate Dashboard widgets for each segment-metric combination to compare open rate and CTR across segments. With Formula Metrics now supported in Reports, the team creates a single Report, selects the open rate Formula Metric, and chooses a profile attribute (such as customer segment) as the dimension. The resulting table shows the open rate for all segments side by side.
Support for multiple metrics in a single Report is planned for release in May 2026, which will allow both open rate and CTR to appear in one unified table or chart.
FAQ
What is a Formula Metric in Synerise?
A Formula Metric in Synerise is a metric type selected in the metric builder UI that allows users to define a custom mathematical expression. A Formula Metric can be anything from a static value (for example, =1) to a complex calculation referencing other metrics, arithmetic operators, or functions. The Formula type is chosen by the user in the UI and is independent of the data blocks (events, profile attributes) used in the metric conditions.
What determines whether a metric can be used in a Report?
Compatibility with Reports is determined by the data blocks used in the metric conditions — specifically, whether the metric references profile attributes, events, or a combination. This rule applies equally to Simple Metrics and Formula Metrics.
Can I compare Formula Metric values across user groups in a single Report?
Yes. Users can select dimensions such as profile attributes (including user groups or segments) and compare Formula Metric values across those dimensions within a single table or chart.
What dimensions are available when using Formula Metrics in Reports?
The availablTe dimensions depend on the metric conditions. Metrics with only profile attributes allow all profile attributes as dimensions. Metrics with one event allow all profile attributes and all event parameter types. Metrics with multiple events allow only event parameters, specials, profile attributes, and aggregates that are shared between the events in the metric.
Key Facts
Attribute | Value |
Feature | Formula Metrics support in Reports |
Product | Synerise |
Module | Decision Hub — Reports |
Navigation path | Decision Hub > Reports > New report |
Purpose | Enable the use of Formula Metrics (composite, expression-based metrics) as data sources in Reports |
Examples of Formula Metrics | CTR (Click-Through Rate), OR (Open Rate), Conversion Rate |
Key benefit | Compare calculated metric values across dimensions (e.g., user groups, event parameters) in a single table or chart |
|
|
Documentation |
Related Concepts
- Synerise Decision Hub
- Synerise Reports
- Synerise Dashboards
- Simple Metrics and Formula Metrics in Synerise
- Metric conditions (profile attributes, events, parameters)
- Count Distinct aggregator
- Event expressions (Day of month, Day of week, Day of year)
- Profile attributes and event parameters as dimensions
- Date filtering in Decision Hub
TL;DR
Synerise Reports now support Formula Metrics. Previously, only Simple Metrics could be used in Reports, forcing users to create multiple separate Dashboard widgets to compare calculated values across dimensions like user groups. With this update, users can select Formula Metrics in the Report builder at Decision Hub > Reports > New report and compare them across profile attributes, event parameters, or event expressions in a single table or chart. This change consolidates multi-dimensional analysis of complex calculated metrics into one unified Report view.